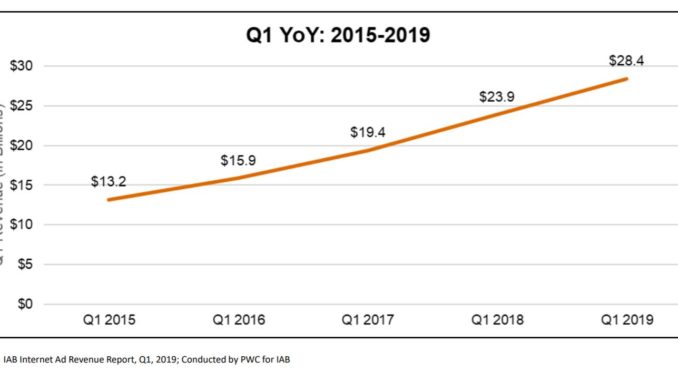
The Interactive Advertising Bureau (IAB) released a new Internet Advertising Revenue Report this morning, conducted in partnership with PwC. The report revealed that digital ad spend in the US reached $28.4 billion in Q1 of 2019. This is up 18% YoY from Q1 of last year, which hit $23.9 billion.
In the graph below, we see the growth of US digital ad spend in the first quarter of each year from 2015 to 2019.
Commenting on the report, David Silverman, Partner at PwC US said:
“These historic Q1 figures are in keeping with digital’s ongoing rise. Its diverse platforms are attracting audiences to share, shop, listen, learn, and be entertained. Brand dollars are naturally following mainstream consumer consumption.”
Where is all this digital ad spend going?
A separate survey from May/June of 2019 found that paid search largely dominates the digital ad landscape, comprising nearly 40% of budgets.
In second place comes paid social, at just under 20% of budgets. Other channels included display, YouTube, mobile/in-app, Amazon, and other ecommerce.
Which industries have the highest digital ad spend?
eMarketer recently released interesting findings on digital ad spend by industry.
In the graph below, we see retail with the highest spend at 21.9% of the total share. Automotive and financial services come in second and third, both at just over 12%.
eMarketer also added that they expect that in 2020, “financial services will displace the auto sector, while travel will surpass consumer packaged goods (CPG).”
They attribute part of the growth of the travel sector’s ad budgets to brands’ increasing need to fight for consumer attention.
Notably, they say that the travel sector’s mobile ad spend surpasses that of any other industry: 70.1% of its total digital ad budget.
The post US digital ad spend up 18% YoY, new IAB report says appeared first on ClickZ.
Source: ClickZ
Link: US digital ad spend up 18% YoY, new IAB report says


Leave a Reply